SSD under test: Samsung SSD 870 QVO

Simon Lüthje
Simon Lüthje · 6 Minuten Lesezeit

With the Samsung SSD 870 QVO, the Koreans are launching their second generation of the so-called QLC SSD. The product family with its own QLC NAND flash was founded in 2018, when Samsung was already able to convince a large number of customers with the 860 QVO series. So it is not surprising that the successful series was relaunched. Whether the comparatively inexpensive SSD can also offer a correspondingly good performance, we would like to check in our review.

What does QVO stand for?

With QVO, Samsung has coined an abbreviation for “Quality and Value Optimized”. Here it becomes clear what Samsung is aiming at with its product range. The QVO products should offer high quality at a great price-performance ratio. The Koreans make the low price possible with a custom-made QLC memory. Thanks to its high memory density, this ensures that the cost per bit is lower in the long term. This ensures that storage media such as SSDs and memory cards become less expensive. A disadvantage of QLC technology, however, is its speed and durability. In contrast to the premium series EVO and PRO, the SSDs of the 870 QVO series are not only slower but also less durable.

We have tested the version with 1 TB storage space.

Technical data

Dimensions (W x H x D) 100 mm x 69.85 mm x 6.8 mm
Performance up to 560 MB/s sequential read speed
Weight 57 grams
Application Client PCs
Interfaces SATA 6 Gb/s interface, compatible with SATA 3 Gb/s & SATA 1.5 Gb/s interface
Warranty 3 years manufacturer warranty (max. 2880 TBW)
Price 1 TB: € 85.99 *, 2 TB: € 193.04 *, 4 TB: € 315.56 *, 8 TB: € 589.00 *

A new controller and memory

The 860 QVO already relied on a corresponding QLC memory. However, Samsung has opted for a new QLC memory in the new series. While the 860 QVO still relied on a NAND memory with 64 layers, the new version offers 96 layers. But this is not the only innovation. The Koreans also use a new controller. According to the manufacturer, this should not only provide more performance. In addition, the revisions also allow for a doubling of the maximum memory space. This is doubled from 4 TB to 8 TB.

More performance than the predecessor

Of course, Samsung is hoping for performance improvements by upgrading the memory and controller. However, a look at the manufacturer’s specifications makes it clear that the performance only increases marginally in comparison to the predecessor. Thus, the 870 QVO offers only 10 MB/s more transfer rates with 560 MB/s (read) and 530 MB/s (write). The same should apply to the IOPS. Here, almost 13 percent more IOPS should be possible in 4K random read. But it also remains somewhat the same: The guarantee. Thus, the 870 QVO, like its predecessor, also offers a three-year manufacturer’s warranty. However, this can also expire prematurely. This is the case if the number of Total Bytes Write (TBW) is exceeded. The number is 360 terabytes, just like the predecessor.

At first glance, the 870 QVO cannot be distinguished from the premium models PRO and EVO.

Many things from our own production

Samsung has not only manufactured the memory and the controller in its own production. The Koreans also developed the DRAM cache themselves. Here the tech group relies on LPDDR4 memory. This should primarily be characterized by economical operation. Samsung remains true to its self-imposed rule. The manufacturer uses 1 GB DRAM per 1 TB NAND flash. This ensures that the top model with a proud 8 terabytes of memory also has an impressive 8 GB LPDDR4. Otherwise the SSD would probably suffer from noticeable performance drops.

Some things stay the same

In the SLC cache area, Samsung leaves the previous one from the 860 QVO. The so-called TurboWrite function makes sure that 6 GB are available at any time. Should the free data make it possible, this even increases to up to 78 GB. Accordingly, the writing performance of the SLC cache doesn’t change in the new series. For example, the largest version with 8 TB should only allow 160 MB/s for sequential writing. Unfortunately, an improvement over the predecessor can’t be seen here.

New memory for more durability

But the new storage facility is expected to bring significant improvements in one area. This primarily concerns the durability of the SSD. For example, the memory cells of the SLC cache should be able to offer a much higher durability. Especially the so-called SLC-Endurance will be increased. This is achieved by switching from 64 layers (860 QVO) to 96 layers (870 QVO).
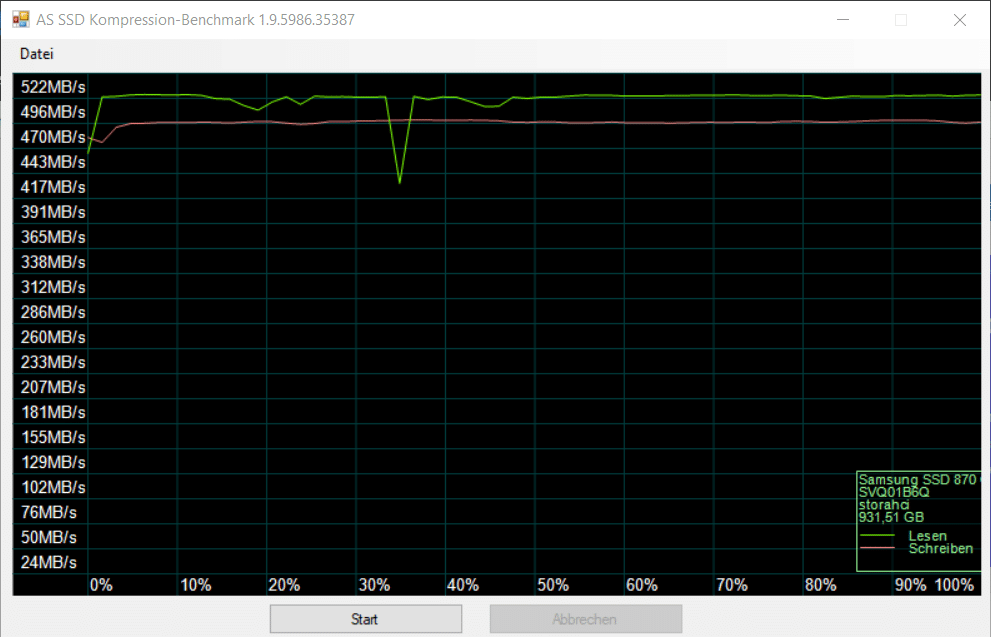
Performance tests

In order to put the Samsung 870 QVO SSD through its paces, we put it through a few benchmarks.

Our test system

Benchmarks

if (typeof (wpDataCharts) == 'undefined') wpDataCharts = {}; wpDataCharts[21] = { render_data: {"wdtNumberFormat":"1","options":{"title":{"text":"SATA-SSDs - AS SSD Benchmark","floating":false,"align":"center"},"series":[{"type":"","name":"Seq (lesen, MB\/s)","color":"","label":"Seq (lesen, MB\/s)","orig_header":"seqlesenmbs","data":[506.29,516.37,526.2,528.46,489.92,463.37,522.71,523.8,517.78,526.54],"yAxis":0},{"type":"","name":"Seq (schreiben, MB\/s)","color":"","label":"Seq (schreiben, MB\/s)","orig_header":"seqschreibenmbs","data":[468.26,472.97,498.49,498.5,496.99,371.8,460.83,494.89,401.51,493.04],"yAxis":0},{"type":"","name":"4K (lesen, MB\/s)","color":"","label":"4K (lesen, MB\/s)","orig_header":"4klesenmbs","data":[20.07,32.4,45.57,43.69,36.36,27.4,15.56,35.53,24.52,37.07],"yAxis":0},{"type":"","name":"4K (schreiben, MB\/s)","color":"","label":"4K (schreiben, MB\/s)","orig_header":"4kschreibenmbs","data":[83.41,113.85,129.23,130.2,88.72,70.12,92.66,96.22,70.22,90.57],"yAxis":0},{"type":"","name":"4K-64-Thrd (lesen, MB\/s)","color":"","label":"4K-64-Thrd (lesen, MB\/s)","orig_header":"4k64thrdlesenmbs","data":[353.98,376.93,377.11,378.8,373.74,268.58,205.45,368.67,238.72,372.59],"yAxis":0},{"type":"","name":"4K-64-Thrd (schreiben, MB\/s)","color":"","label":"4K-64-Thrd (schreiben, MB\/s)","orig_header":"4k64thrdschreibenmbs","data":[228.57,349.97,340.89,342.79,334.34,168.03,220.96,331.16,226.73,337.2],"yAxis":0}],"xAxis":{"categories":["Toshiba Q300 Pro 1TB","Crucial BX300 480 GB","Samsung SSD 860 PRO 1 TB","Samsung SSD 860 EVO 1 TB","SanDisk Ultra 3D 500 GB","Toshiba TR200 960 GB","Verbatim Vi560 S3 512 GB","Samsung SSD 870 QVO 1 TB","LC-Power Phoenix 480 GB","Samsung SSD 870 EVO 2 TB"],"crosshair":false},"yAxis":[{"gridLineDashStyle":"solid","title":{"text":""},"crosshair":false},[],[],[],[],[]],"chart":{"backgroundColor":"","borderWidth":0,"borderColor":"","borderRadius":0,"zoomType":"none","panning":false,"panKey":"shift","plotBackgroundColor":"","plotBackgroundImage":"","plotBorderColor":"","plotBorderWidth":"","inverted":false},"subtitle":{"text":"","align":"center"},"tooltip":{"enabled":true,"backgroundColor":"rgba(255,255,255,0.85)","borderWidth":"1","borderColor":"","borderRadius":3,"shared":false,"valuePrefix":"","valueSuffix":""},"legend":{"enabled":true,"backgroundColor":"","title":{"text":""},"layout":"horizontal","align":"center","verticalAlign":"bottom","borderWidth":"0","borderColor":"","borderRadius":"0"},"exporting":{"enabled":false,"chartOptions":{"plotOptions":{"series":{"dataLabels":{"enabled":false}}}},"filename":"","width":"","buttons":{"contextButton":{"align":"right","verticalAlign":"top","symbolStroke":"#666","text":""}}},"credits":{"enabled":false,"href":"http:\/\/www.highcharts.com","text":"Highcharts.com"}},"type":"highcharts_basic_bar_chart","column_indexes":[1,2,3,4,5,6,7],"height":"600"}, engine: "highcharts", type: "highcharts_basic_bar_chart", title: "SATA-SSDs - AS SSD Benchmark", container: "wpDataChart_21", follow_filtering: 1, wpdatatable_id: 21, group_chart: 0 }
wdt_ID SSD Seq (lesen, MB/s) Seq (schreiben, MB/s) 4K (lesen, MB/s) 4K (schreiben, MB/s) 4K-64-Thrd (lesen, MB/s) 4K-64-Thrd (schreiben, MB/s)
1 Toshiba Q300 Pro 1TB 506,29 468,26 20,07 83,41 353,98 228,57
2 Crucial BX300 480 GB 516,37 472,97 32,40 113,85 376,93 349,97
3 Samsung SSD 860 PRO 1 TB 526,20 498,49 45,57 129,23 377,11 340,89
4 Samsung SSD 860 EVO 1 TB 528,46 498,50 43,69 130,20 378,80 342,79
5 SanDisk Ultra 3D 500 GB 489,92 496,99 36,36 88,72 373,74 334,34
7 Toshiba TR200 960 GB 463,37 371,80 27,40 70,12 268,58 168,03
8 Verbatim Vi560 S3 512 GB 522,71 460,83 15,56 92,66 205,45 220,96
9 Samsung SSD 870 QVO 1 TB 523,80 494,89 35,53 96,22 368,67 331,16
10 LC-Power Phoenix 480 GB 517,78 401,51 24,52 70,22 238,72 226,73
11 Samsung SSD 870 EVO 2 TB 526,54 493,04 37,07 90,57 372,59 337,20
SSD Seq (lesen, MB/s) Seq (schreiben, MB/s) 4K (lesen, MB/s) 4K (schreiben, MB/s) 4K-64-Thrd (lesen, MB/s) 4K-64-Thrd (schreiben, MB/s)
table.wpDataTable td.numdata { text-align: right !important; }
if (typeof (wpDataCharts) == 'undefined') wpDataCharts = {}; wpDataCharts[22] = { render_data: {"wdtNumberFormat":"1","options":{"title":{"text":"SATA-SSDs - AS SSD Benchmark Score","floating":false,"align":"center"},"series":[{"type":"","name":"Lesen","color":"","label":"Lesen","orig_header":"lesen","data":[425,461,474,475,459,342,273,457,315,461],"yAxis":0},{"type":"","name":"Schreiben","color":"","label":"Schreiben","orig_header":"schreiben","data":[359,511,520,523,473,275,360,477,337,477],"yAxis":0},{"type":"","name":"Gesamt","color":"","label":"Gesamt","orig_header":"gesamt","data":[1004,1217,1252,1256,1180,798,774,1178,816,1183],"yAxis":0}],"xAxis":{"categories":["Toshiba Q300 Pro 1TB","Crucial BX300 480 GB","Samsung SSD 860 PRO 1 TB","Samsung SSD 860 EVO 1 TB","SanDisk Ultra 3D 500 GB","Toshiba TR200 960 GB","Verbatim Vi560 S3 512 GB","Samsung SSD 870 QVO 1 TB","LC-Power Phoenix 480 GB","Samsung SSD 870 EVO 2 TB"],"crosshair":false},"yAxis":[{"gridLineDashStyle":"solid","title":{"text":""},"crosshair":false},[],[]],"chart":{"backgroundColor":"","borderWidth":0,"borderColor":"","borderRadius":0,"zoomType":"none","panning":false,"panKey":"shift","plotBackgroundColor":"","plotBackgroundImage":"","plotBorderColor":"","plotBorderWidth":"","inverted":false},"subtitle":{"text":"","align":"center"},"tooltip":{"enabled":true,"backgroundColor":"rgba(255,255,255,0.85)","borderWidth":"1","borderColor":"","borderRadius":3,"shared":false,"valuePrefix":"","valueSuffix":""},"legend":{"enabled":true,"backgroundColor":"","title":{"text":""},"layout":"horizontal","align":"center","verticalAlign":"bottom","borderWidth":"0","borderColor":"","borderRadius":"0"},"exporting":{"enabled":false,"chartOptions":{"plotOptions":{"series":{"dataLabels":{"enabled":false}}}},"filename":"","width":"","buttons":{"contextButton":{"align":"right","verticalAlign":"top","symbolStroke":"#666","text":""}}},"credits":{"enabled":false,"href":"http:\/\/www.highcharts.com","text":"Highcharts.com"}},"type":"highcharts_basic_bar_chart","column_indexes":[1,2,3,4],"height":"400"}, engine: "highcharts", type: "highcharts_basic_bar_chart", title: "SATA-SSDs - AS SSD Benchmark Score", container: "wpDataChart_22", follow_filtering: 1, wpdatatable_id: 22, group_chart: 0 }
wdt_ID SSD Lesen Schreiben Gesamt
1 Toshiba Q300 Pro 1TB 425 359 1.004
2 Crucial BX300 480 GB 461 511 1.217
3 Samsung SSD 860 PRO 1 TB 474 520 1.252
4 Samsung SSD 860 EVO 1 TB 475 523 1.256
5 SanDisk Ultra 3D 500 GB 459 473 1.180
7 Toshiba TR200 960 GB 342 275 798
8 Verbatim Vi560 S3 512 GB 273 360 774
9 Samsung SSD 870 QVO 1 TB 457 477 1.178
10 LC-Power Phoenix 480 GB 315 337 816
11 Samsung SSD 870 EVO 2 TB 461 477 1.183
SSD Lesen Schreiben Gesamt
table.wpDataTable td.numdata { text-align: right !important; }

if (typeof (wpDataCharts) == 'undefined') wpDataCharts = {}; wpDataCharts[24] = { render_data: {"wdtNumberFormat":"1","options":{"title":{"text":"SATA-SSDs - AS SSD Kopier-Benchmark","floating":false,"align":"center"},"series":[{"type":"","name":"ISO (in MB\/s)","color":"","label":"ISO (in MB\/s)","orig_header":"isoinmbs","data":[380.64,257.05,475.42,460.7,561.93,252.77,267.41,269.89,215.69,472.84],"yAxis":0},{"type":"","name":"Programm (in MB\/s)","color":"","label":"Programm (in MB\/s)","orig_header":"programminmbs","data":[193.1,105.71,328.58,327.49,416.23,131.44,109.81,118.24,103.9,309.7],"yAxis":0},{"type":"","name":"Spiel (in MB\/s)","color":"","label":"Spiel (in MB\/s)","orig_header":"spielinmbs","data":[244.38,183.26,456.63,440.99,505.09,146.53,196.38,243.96,186.73,438.83],"yAxis":0}],"xAxis":{"categories":["Toshiba Q300 Pro 1TB","Crucial BX300 480 GB","Samsung SSD 860 PRO 1 TB","Samsung SSD 860 EVO 1 TB","SanDisk Ultra 3D 500 GB","Toshiba TR200 960 GB","Verbatim Vi560 S3 512 GB","Samsung SSD 870 QVO 1 TB","LC-Power Phoenix 480 GB","Samsung SSD 870 EVO 2 TB"],"crosshair":false},"yAxis":[{"gridLineDashStyle":"solid","title":{"text":""},"crosshair":false},[],[]],"chart":{"backgroundColor":"","borderWidth":0,"borderColor":"","borderRadius":0,"zoomType":"none","panning":false,"panKey":"shift","plotBackgroundColor":"","plotBackgroundImage":"","plotBorderColor":"","plotBorderWidth":"","inverted":false},"subtitle":{"text":"","align":"center"},"tooltip":{"enabled":true,"backgroundColor":"rgba(255,255,255,0.85)","borderWidth":"1","borderColor":"","borderRadius":3,"shared":false,"valuePrefix":"","valueSuffix":""},"legend":{"enabled":true,"backgroundColor":"","title":{"text":""},"layout":"horizontal","align":"center","verticalAlign":"bottom","borderWidth":"0","borderColor":"","borderRadius":"0"},"exporting":{"enabled":false,"chartOptions":{"plotOptions":{"series":{"dataLabels":{"enabled":false}}}},"filename":"","width":"","buttons":{"contextButton":{"align":"right","verticalAlign":"top","symbolStroke":"#666","text":""}}},"credits":{"enabled":false,"href":"http:\/\/www.highcharts.com","text":"Highcharts.com"}},"type":"highcharts_basic_bar_chart","column_indexes":[1,2,3,4],"height":"400"}, engine: "highcharts", type: "highcharts_basic_bar_chart", title: "SATA-SSDs - AS SSD Kopier-Benchmark", container: "wpDataChart_24", follow_filtering: 1, wpdatatable_id: 24, group_chart: 0 }
wdt_ID SSD ISO (in MB/s) Programm (in MB/s) Spiel (in MB/s)
1 Toshiba Q300 Pro 1TB 380,64 193,10 244,38
2 Crucial BX300 480 GB 257,05 105,71 183,26
3 Samsung SSD 860 PRO 1 TB 475,42 328,58 456,63
4 Samsung SSD 860 EVO 1 TB 460,70 327,49 440,99
5 SanDisk Ultra 3D 500 GB 561,93 416,23 505,09
7 Toshiba TR200 960 GB 252,77 131,44 146,53
8 Verbatim Vi560 S3 512 GB 267,41 109,81 196,38
9 Samsung SSD 870 QVO 1 TB 269,89 118,24 243,96
10 LC-Power Phoenix 480 GB 215,69 103,90 186,73
11 Samsung SSD 870 EVO 2 TB 472,84 309,70 438,83
SSD ISO (in MB/s) Programm (in MB/s) Spiel (in MB/s)
table.wpDataTable td.numdata { text-align: right !important; }
if (typeof (wpDataCharts) == 'undefined') wpDataCharts = {}; wpDataCharts[20] = { render_data: {"wdtNumberFormat":"1","options":{"title":{"text":"SATA-SSDs - CrystalDiskMark","floating":false,"align":"center"},"series":[{"type":"","name":"Seq Q32T1 (lesen, in MB\/s)","color":"","label":"Seq Q32T1 (lesen, in MB\/s)","orig_header":"seqq32t1leseninmbs","data":[544.4,552.9,560.4,562.2,563,549.6,560.5,560,520,561.4],"yAxis":0},{"type":"","name":"Seq Q32T1 (schreiben, in MB\/s)","color":"","label":"Seq Q32T1 (schreiben, in MB\/s)","orig_header":"seqq32t1schreibeninmbs","data":[504.5,514.2,529.4,533.1,534.1,519.8,373.1,529.1,442.8,528.9],"yAxis":0},{"type":"","name":"4K Q32T1 (lesen, in MB\/s)","color":"","label":"4K Q32T1 (lesen, in MB\/s)","orig_header":"4kq32t1leseninmbs","data":[347.9,377.2,398.4,403.1,394.7,307.9,252.8,295.1,248.3,312.8],"yAxis":0},{"type":"","name":"4K Q32T1 (schreiben, in MB\/s)","color":"","label":"4K Q32T1 (schreiben, in MB\/s)","orig_header":"4kq32t1schreibeninmbs","data":[334.3,356.3,357.2,359,361.1,256,189.3,299.1,219.6,284.5],"yAxis":0},{"type":"","name":"Seq (lesen, in MB\/s)","color":"","label":"Seq (lesen, in MB\/s)","orig_header":"seqleseninmbs","data":[522.8,535.3,537.9,551.3,294.1,483.4,507.5,533.5,440.8,542.2],"yAxis":0},{"type":"","name":"Seq (schreiben, in MB\/s)","color":"","label":"Seq (schreiben, in MB\/s)","orig_header":"seqschreibeninmbs","data":[483.4,499.1,514.8,522.8,276.9,398.6,372.7,501.1,436.9,503],"yAxis":0},{"type":"","name":"4K (lesen, in MB\/s)","color":"","label":"4K (lesen, in MB\/s)","orig_header":"4kleseninmbs","data":[26.93,32.73,49.47,48.49,40.71,29.31,24.52,35.77,27.14,42.89],"yAxis":0},{"type":"","name":"4K (schreiben, in MB\/s)","color":"","label":"4K (schreiben, in MB\/s)","orig_header":"4kschreibeninmbs","data":[96.19,143.1,151.3,155,110.6,79.3,91.99,97.54,61.66,93.74],"yAxis":0}],"xAxis":{"categories":["Toshiba Q300 Pro 1TB","Crucial BX300 480 GB","Samsung SSD 860 PRO 1 TB","Samsung SSD 860 EVO 1 TB","SanDisk Ultra 3D 500 GB","Toshiba TR200 960 GB","Verbatim Vi560 S3 512 GB","Samsung SSD 870 QVO 1 TB","LC-Power Phoenix 480 GB","Samsung SSD 870 EVO 2 TB"],"crosshair":false},"yAxis":[{"gridLineDashStyle":"solid","title":{"text":""},"crosshair":false},[],[],[],[],[],[],[]],"chart":{"backgroundColor":"","borderWidth":0,"borderColor":"","borderRadius":0,"zoomType":"none","panning":false,"panKey":"shift","plotBackgroundColor":"","plotBackgroundImage":"","plotBorderColor":"","plotBorderWidth":"","inverted":false},"subtitle":{"text":"","align":"center"},"tooltip":{"enabled":true,"backgroundColor":"rgba(255,255,255,0.85)","borderWidth":"1","borderColor":"","borderRadius":3,"shared":false,"valuePrefix":"","valueSuffix":""},"legend":{"enabled":true,"backgroundColor":"","title":{"text":""},"layout":"horizontal","align":"center","verticalAlign":"bottom","borderWidth":"0","borderColor":"","borderRadius":"0"},"exporting":{"enabled":false,"chartOptions":{"plotOptions":{"series":{"dataLabels":{"enabled":false}}}},"filename":"","width":"","buttons":{"contextButton":{"align":"right","verticalAlign":"top","symbolStroke":"#666","text":""}}},"credits":{"enabled":false,"href":"http:\/\/www.highcharts.com","text":"Highcharts.com"}},"type":"highcharts_basic_bar_chart","column_indexes":[1,2,3,4,5,6,7,8,9],"height":"700"}, engine: "highcharts", type: "highcharts_basic_bar_chart", title: "SATA-SSDs - CrystalDiskMark", container: "wpDataChart_20", follow_filtering: 1, wpdatatable_id: 20, group_chart: 0 }
wdt_ID SSD Seq Q32T1 (lesen, in MB/s) Seq Q32T1 (schreiben, in MB/s) 4K Q32T1 (lesen, in MB/s) 4K Q32T1 (schreiben, in MB/s) Seq (lesen, in MB/s) Seq (schreiben, in MB/s) 4K (lesen, in MB/s) 4K (schreiben, in MB/s)
1 Toshiba Q300 Pro 1TB 544,40 504,50 347,90 334,30 522,80 483,40 26,93 96,19
2 Crucial BX300 480 GB 552,90 514,20 377,20 356,30 535,30 499,10 32,73 143,10
3 Samsung SSD 860 PRO 1 TB 560,40 529,40 398,40 357,20 537,90 514,80 49,47 151,30
4 Samsung SSD 860 EVO 1 TB 562,20 533,10 403,10 359,00 551,30 522,80 48,49 155,00
5 SanDisk Ultra 3D 500 GB 563,00 534,10 394,70 361,10 294,10 276,90 40,71 110,60
6 Toshiba TR200 960 GB 549,60 519,80 307,90 256,00 483,40 398,60 29,31 79,30
7 Verbatim Vi560 S3 512 GB 560,50 373,10 252,80 189,30 507,50 372,70 24,52 91,99
8 Samsung SSD 870 QVO 1 TB 560,00 529,10 295,10 299,10 533,50 501,10 35,77 97,54
9 LC-Power Phoenix 480 GB 520,00 442,80 248,30 219,60 440,80 436,90 27,14 61,66
10 Samsung SSD 870 EVO 2 TB 561,40 528,90 312,80 284,50 542,20 503,00 42,89 93,74
SSD Seq Q32T1 (lesen, in MB/s) Seq Q32T1 (schreiben, in MB/s) 4K Q32T1 (lesen, in MB/s) 4K Q32T1 (schreiben, in MB/s) Seq (lesen, in MB/s) Seq (schreiben, in MB/s) 4K (lesen, in MB/s) 4K (schreiben, in MB/s)
table.wpDataTable td.numdata { text-align: right !important; }
if (typeof (wpDataCharts) == 'undefined') wpDataCharts = {}; wpDataCharts[25] = { render_data: {"wdtNumberFormat":"1","options":{"title":{"text":"SATA-SSDs - HD Tune Pro","floating":false,"align":"center"},"series":[{"type":"","name":"Minimum (in MB\/s)","color":"","label":"Minimum (in MB\/s)","orig_header":"minimuminmbs","data":[298.1,323.6,438,451.3,415.7,447.3,306.2,353.6,337.3,313.8],"yAxis":0},{"type":"","name":"Maximum (in MB\/s)","color":"","label":"Maximum (in MB\/s)","orig_header":"maximuminmbs","data":[408,443.3,460.3,459.3,438.2,455.9,349.4,413.9,398.1,370.1],"yAxis":0},{"type":"","name":"Average (in MB\/s)","color":"","label":"Average (in MB\/s)","orig_header":"averageinmbs","data":[351.1,428.4,456.4,456.9,434.6,454.7,324.3,373.5,365.1,337.1],"yAxis":0}],"xAxis":{"categories":["Toshiba Q300 Pro 1TB","Crucial BX300 480 GB","Samsung SSD 860 PRO 1 TB","Samsung SSD 860 EVO 1 TB","SanDisk Ultra 3D 500 GB","Toshiba TR200 960 GB","Verbatim Vi560 S3 512 GB","Samsung SSD 870 QVO 1 TB","LC-Power Phoenix 480 GB","Samsung SSD 870 EVO 2 TB"],"crosshair":false},"yAxis":[{"gridLineDashStyle":"solid","title":{"text":""},"crosshair":false},[],[]],"chart":{"backgroundColor":"","borderWidth":0,"borderColor":"","borderRadius":0,"zoomType":"none","panning":false,"panKey":"shift","plotBackgroundColor":"","plotBackgroundImage":"","plotBorderColor":"","plotBorderWidth":"","inverted":false},"subtitle":{"text":"","align":"center"},"tooltip":{"enabled":true,"backgroundColor":"rgba(255,255,255,0.85)","borderWidth":"1","borderColor":"","borderRadius":3,"shared":false,"valuePrefix":"","valueSuffix":""},"legend":{"enabled":true,"backgroundColor":"","title":{"text":""},"layout":"horizontal","align":"center","verticalAlign":"bottom","borderWidth":"0","borderColor":"","borderRadius":"0"},"exporting":{"enabled":false,"chartOptions":{"plotOptions":{"series":{"dataLabels":{"enabled":false}}}},"filename":"","width":"","buttons":{"contextButton":{"align":"right","verticalAlign":"top","symbolStroke":"#666","text":""}}},"credits":{"enabled":false,"href":"http:\/\/www.highcharts.com","text":"Highcharts.com"}},"type":"highcharts_basic_bar_chart","column_indexes":[1,2,3,4],"height":"400"}, engine: "highcharts", type: "highcharts_basic_bar_chart", title: "SATA-SSDs - HD Tune Pro", container: "wpDataChart_25", follow_filtering: 1, wpdatatable_id: 25, group_chart: 0 }
wdt_ID SSD Minimum (in MB/s) Maximum (in MB/s) Average (in MB/s)
1 Toshiba Q300 Pro 1TB 298,10 408,00 351,10
2 Crucial BX300 480 GB 323,60 443,30 428,40
3 Samsung SSD 860 PRO 1 TB 438,00 460,30 456,40
4 Samsung SSD 860 EVO 1 TB 451,30 459,30 456,90
5 SanDisk Ultra 3D 500 GB 415,70 438,20 434,60
7 Toshiba TR200 960 GB 447,30 455,90 454,70
8 Verbatim Vi560 S3 512 GB 306,20 349,40 324,30
9 Samsung SSD 870 QVO 1 TB 353,60 413,90 373,50
10 LC-Power Phoenix 480 GB 337,30 398,10 365,10
11 Samsung SSD 870 EVO 2 TB 313,80 370,10 337,10
SSD Minimum (in MB/s) Maximum (in MB/s) Average (in MB/s)
table.wpDataTable td.numdata { text-align: right !important; }
if (typeof (wpDataCharts) == 'undefined') wpDataCharts = {}; wpDataCharts[23] = { render_data: {"wdtNumberFormat":"1","options":{"title":{"text":"SATA-SSDs - Zugriffszeiten","floating":false,"align":"center"},"series":[{"type":"","name":"AS SSD (schreiben)","color":"","label":"AS SSD (schreiben)","orig_header":"asssdschreiben","data":[0.04,0.05,0.025,0.024,0.089,2.057,2.501,0.345,2.725,0.037],"yAxis":0},{"type":"","name":"HD Tune Pro","color":"","label":"HD Tune Pro","orig_header":"hdtunepro","data":[0.07,0.028,0.028,0.027,0.035,0.024,0.039,0.03,0.031,0.031],"yAxis":0}],"xAxis":{"categories":["Toshiba Q300 Pro 1TB","Crucial BX300 480 GB","Samsung SSD 860 PRO 1 TB","Samsung SSD 860 EVO 1 TB","SanDisk Ultra 3D 500 GB","Toshiba TR200 960 GB","Verbatim Vi560 S3 512 GB","Samsung SSD 870 QVO 1 TB","LC-Power Phoenix 480 GB","Samsung SSD 870 EVO 2 TB"],"crosshair":false},"yAxis":[{"gridLineDashStyle":"solid","title":{"text":""},"crosshair":false},[]],"chart":{"backgroundColor":"","borderWidth":0,"borderColor":"","borderRadius":0,"zoomType":"none","panning":false,"panKey":"shift","plotBackgroundColor":"","plotBackgroundImage":"","plotBorderColor":"","plotBorderWidth":"","inverted":false},"subtitle":{"text":"","align":"center"},"tooltip":{"enabled":true,"backgroundColor":"rgba(255,255,255,0.85)","borderWidth":"1","borderColor":"","borderRadius":3,"shared":false,"valuePrefix":"","valueSuffix":""},"legend":{"enabled":true,"backgroundColor":"","title":{"text":""},"layout":"horizontal","align":"center","verticalAlign":"bottom","borderWidth":"0","borderColor":"","borderRadius":"0"},"exporting":{"enabled":false,"chartOptions":{"plotOptions":{"series":{"dataLabels":{"enabled":false}}}},"filename":"","width":"","buttons":{"contextButton":{"align":"right","verticalAlign":"top","symbolStroke":"#666","text":""}}},"credits":{"enabled":false,"href":"http:\/\/www.highcharts.com","text":"Highcharts.com"}},"type":"highcharts_basic_bar_chart","column_indexes":[1,2,3],"height":"400"}, engine: "highcharts", type: "highcharts_basic_bar_chart", title: "SATA-SSDs - Zugriffszeiten", container: "wpDataChart_23", follow_filtering: 1, wpdatatable_id: 23, group_chart: 0 }
wdt_ID SSD AS SSD (schreiben) HD Tune Pro
1 Toshiba Q300 Pro 1TB 0,040 0,070
2 Crucial BX300 480 GB 0,050 0,028
3 Samsung SSD 860 PRO 1 TB 0,025 0,028
4 Samsung SSD 860 EVO 1 TB 0,024 0,027
5 SanDisk Ultra 3D 500 GB 0,089 0,035
7 Toshiba TR200 960 GB 2,057 0,024
8 Verbatim Vi560 S3 512 GB 2,501 0,039
9 Samsung SSD 870 QVO 1 TB 0,345 0,030
10 LC-Power Phoenix 480 GB 2,725 0,031
11 Samsung SSD 870 EVO 2 TB 0,037 0,031
SSD AS SSD (schreiben) HD Tune Pro
table.wpDataTable td.numdata { text-align: right !important; }

Conclusion

With the 870 QVO, Samsung has once again brought an SSD with a very good price-performance ratio onto the market. Only the few changes to the previous generation are somewhat disappointing. If you take a look at the specifications, this already becomes clear. Thus, a comparison clearly shows that no significant improvements to the 860 QVO are recognizable despite the new memory and controller.

But if you need more storage space, the new 870 QVO will make you happy. The top model offers a proud 8 TB instead of the previous 4 TB. However, people who want to do a lot of workmanship should avoid the 870 QVO. After all, the SSD is not really faster than a classic HDD.

Detailbewertung

Access times81
Transfer rate (read)83
Transfer rate (write)82
Value for money86

Fazit

Samsung offers an SSD with the 870 QVO at a good price-performance ratio. However, if you work with large amounts of data, you should take a little more money in your hand. Samsung probably offers a better alternative with the EVO and PRO models.

83